Product Analytics for Data-Driven Teams
Track user behavior, analyze conversion funnels, measure feature adoption, and understand retention patterns. Make product decisions based on real user data, not assumptions. Built for product managers, engineers, and growth teams.
Benefits
Strategies to multiply customer loyalty and reduce churn rates.
Refine product capabilities to meet accurate customer needs.
Insights into CX to increase the value derived from each customer relationship.
Dive into underlying issues or irregularities within product.
Develop initiatives to expedite the usage of new products/features.
Increase the percentage of users who complete desired actions.
Hassle-Free Optimization with Product Analytics Experience
Discover how ReplayBird product analytics can help you make data-driven decisions and optimize your digital products.
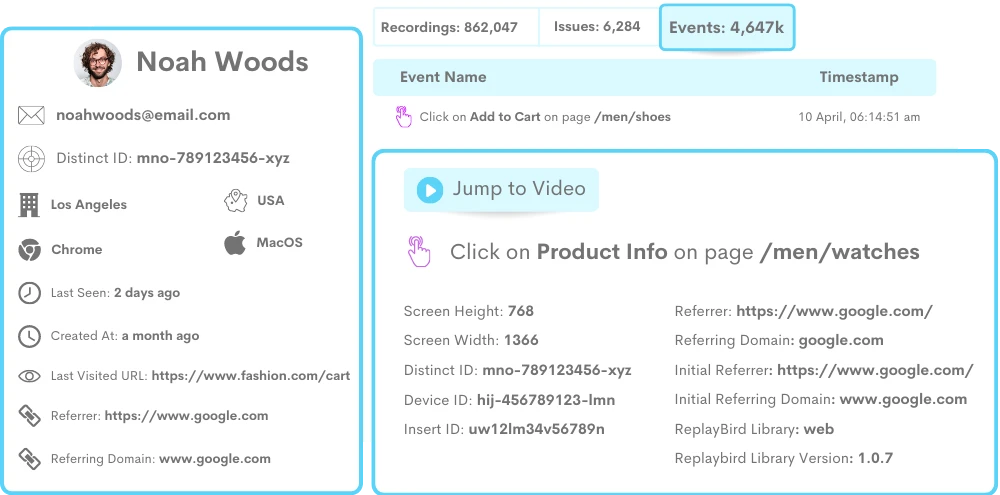
Understand Your Audience Like Never Before
Discover how many users actively engage with your website or application and how long they stay.
- Trend Analysis: Identify trends and patterns, such as peak usage times or common paths users take, which can inform your marketing and development strategies.
- Key Metrics Tracking: Track the number of active sessions, session duration, and other key metrics to assess the effectiveness of your website or application.
- Visitor Analytics: Find the number of unique visitors, returning visitors, and the average time spent on your site or application.
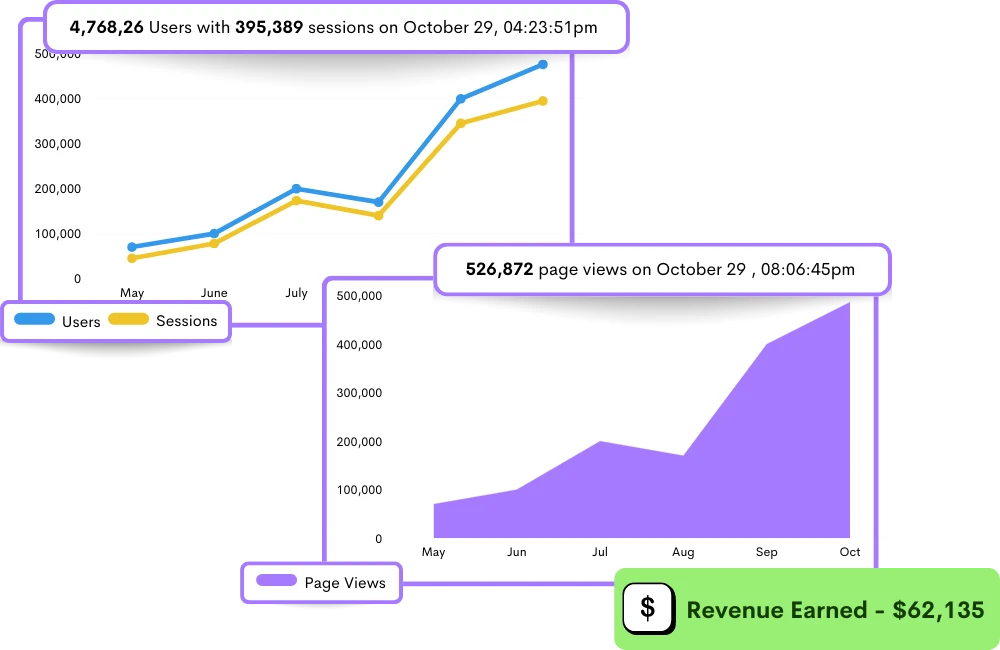
Unveiling User Behavior with Page Views Metrics
Identify popular pages, understand user behavior, find technical errors, evaluate marketing efforts, and improve the website or app design with product analytics.
- Page Performance Tracking: Track when pages suddenly experience a significant drop in page views, indicating an error with the page's functionality or design that needs to be addressed.
- Optimization Opportunities: Find underperforming pages and engagement, and help them optimize their website or app to meet user needs better and drive growth.
Precise View of JavaScript Error Tracking
Track error messages and understand the root cause of the problem with JavaScript error tracking. Prioritize critical errors that impact the majority of your users with product analytics.
- Error Frequency Analysis: Knowing the number of times an error has occurred is critical to understanding the severity of the problem.
- Issue Localization: Identify if the issue is localized or if it is affecting a large number of users with product analytics.
- Error Dashboard: Jump to the error dashboard and understand the overall health of your application.
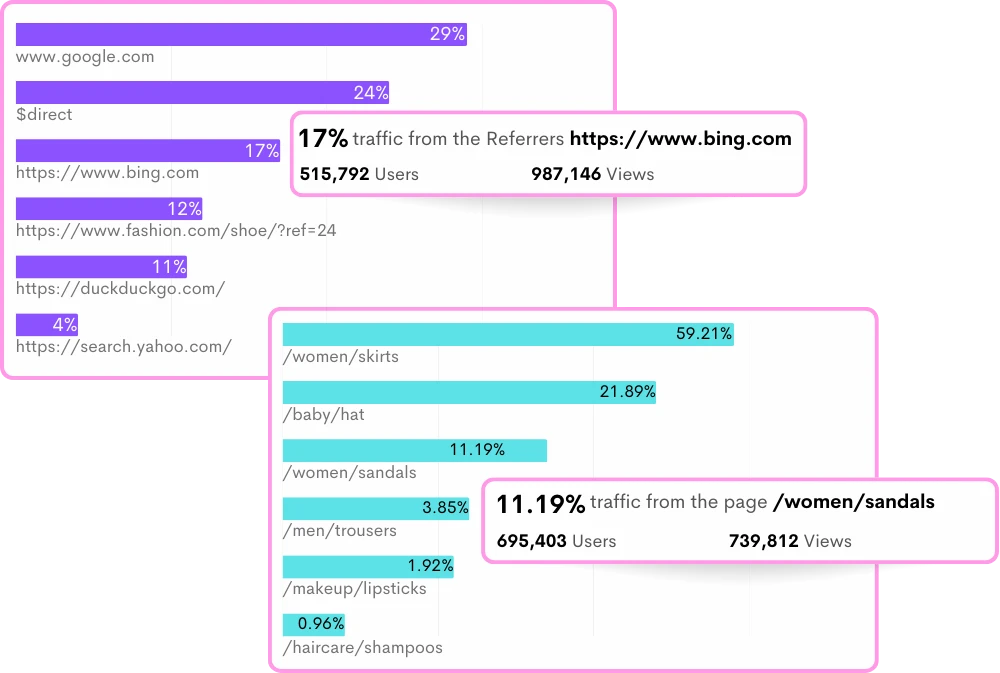
Drive the Most Traffic with Top Referrers
Understand why certain pages are the most frequently visited and which sources drive the most traffic to gain insights into user behavior and website traffic with product analytics.
- Marketing Channels: Identify which marketing channels are driving the most traffic.
- Popular Pages: Optimize your marketing efforts and invest more in the channels that are working best.
- User Browsers: Know which pages on your website are most frequently visited by users to understand user behavior and preferences.
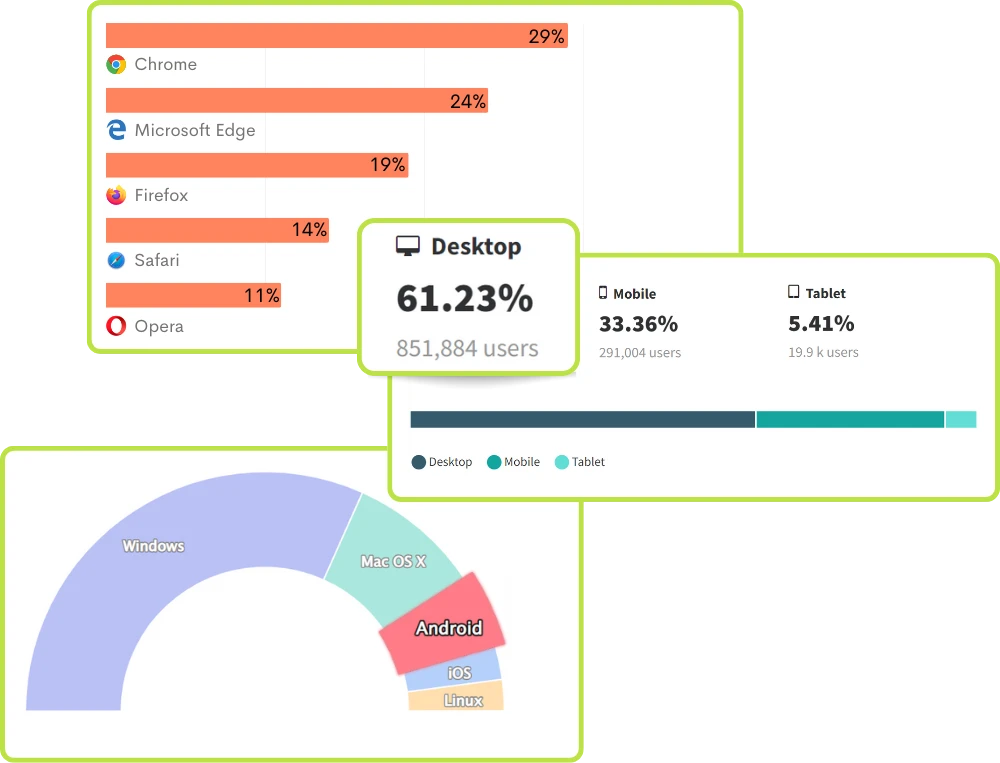
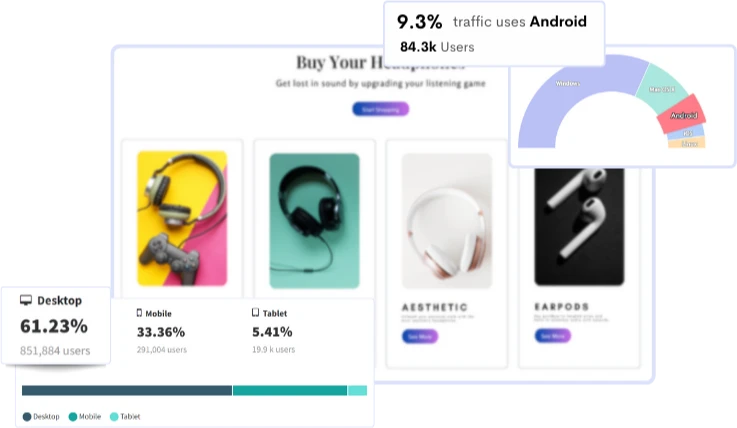
Uncover Insights on Top OS, Device Type, & Browser Usage
Understand the top OS, device type, and user browser to boost the user experience. Efficiently troubleshoot technical errors to deliver an exceptional product experience.
- Browser Compatibility: With top-user browsers, ensure your website is compatible with the most popular browsers, providing a better user experience for visitors.
- Device Analysis: Learn the top device types and OS of their audience so website owners can adjust their content and marketing strategies to better cater to their audience's preferences.
- Error Prioritization: Troubleshoot technical errors more efficiently by prioritizing errors to ensure a better user experience with product analytics.
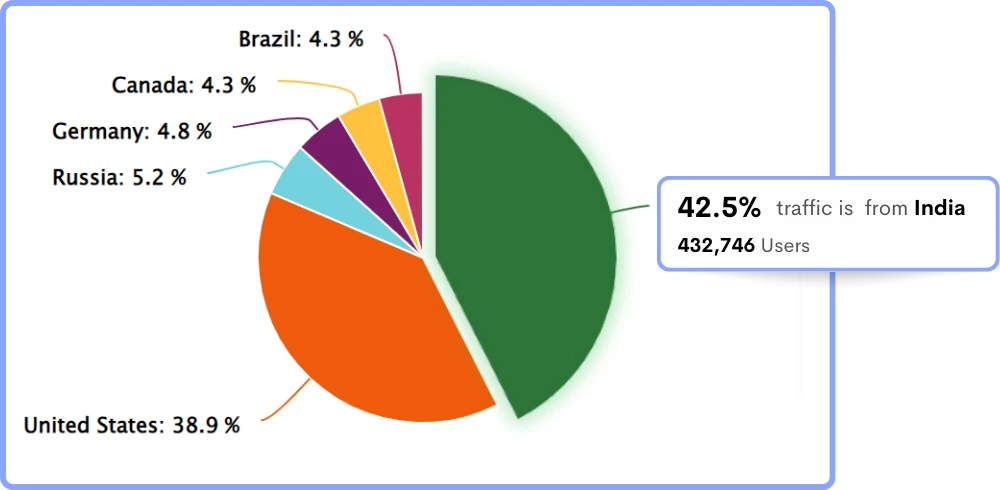
Know Your Top Traffic-Driving Countries
Make informed product analytics decisions about marketing, content, site optimization, revenue generation, performance tracking, user behavior analysis, expansion opportunities, and SEO.
- Market Expansion: Explore new markets and expand their business into new regions with product analytics.
- Regional Insights: Gain insights into how visitors from different regions interact with their website.
- Traffic Monitoring: Track traffic from different countries over time and monitor the performance of their website in different regions.
Frequently Asked Questions
2. Retention Analysis
3. Journey Analysis
4. Attribution Analysis
2. Marketers
3. Sales Leaders
4. Analysts
5. UX/UI Designers and Researchers
6. Data Scientists
Stop guessing what your users want
Understand every user interaction with powerful analytics tools.
Session Replay
Watch exactly how users interact with your product through pixel-perfect session recordings.
Tags & Segments
Organize sessions with tags and create segments for targeted analysis.
Quick Setup
Install in minutes with a single JavaScript snippet. No complex configuration required.
Performance Metrics
Monitor page load times and performance to improve user experience.
Unlimited Team
Invite your entire team and stakeholders at no additional cost.
Privacy Controls
Block IPs, mask sensitive data, and stay compliant with privacy regulations.
Start using ReplayBird for free
Understand your users with session replay, heatmaps, and product analytics.
- Free 14-day trial
- No credit card required
- Unlimited team members
Explore All Features
Everything you need to understand user behavior and improve your product experience.

Product Analytics
Track user behavior, measure engagement, and make data-driven product decisions.

Session Replay
Watch real user sessions to see exactly how users interact with your product.

Interaction Heatmaps
Visualize clicks, scrolls, and engagement patterns across your pages.

Error Tracking
Catch and fix frontend errors before they impact user experience.

Funnel Analysis
Identify drop-off points and optimize your conversion funnels.

Customer Journey
Map the complete user journey from first touch to conversion.

Form Analysis
Understand form interactions and reduce abandonment rates.

Speed Analysis
Monitor performance and its impact on user experience.